As most of modern debuggers like IDA, Oledbg and Windbg seems to fail in debugging old 16 bit COM files. I began researching on different debuggers available today to debug those 16 bit executables ( I am refering to COM files here )
While, doing my research I found a list of debuggers that are available these days to debug 8086 programs. Some of them are listed below
There was another debugger that I couldn't find on the internet and that I used when I wrote my first 8086 assembly program in my university. It is Advance Full Screen Debug a.k.a AFD.
( In usability I will still rate AFD less than that of Insight )
The two images below are of AFD ( left ) and Insight ( Right ) . Insight has a Menu system like the one we see in most of the GUIs of modern applications. Other than that both debuggers have their own features, pros and cons so I am leaving it here for the readers to explore which one is better .


Well continuing my research story I was able to find neither any documentation nor any official site of AFD . So I thought of writing a small manual/document for those who never used any assembly level debugger before.In this article we will try to explore some useful features of AFD that will make assembly language debugging a bit more easier.
I am going to divide this tutorial in two parts. 1st will deal with basic features and 2nd will be on some advance uses of AFD.
So, If you haven't setup the environment for 8086 assembly language programming yet , you should read Setting up AFD, NASM and DOSBOX for 8086 assembly ( Step By Step ) first.
From here on, I will assume that you have configured the environment and you also know a little bit about 8086 assembly language programming.

As an example, in the image to the left, I have pressed "L" while in AFD's cmd and then pressed 'F4' . You can see the help text related to cursor that is currently on character 'L' in cmd.
Note: To load a COM in AFD you can either run afd using this command "afd test.com" where test.com is a filename. Second way is shown in the image, after running AFD , write "L test.com".
I have divided AFD display into 4 parts as shown in the image below.
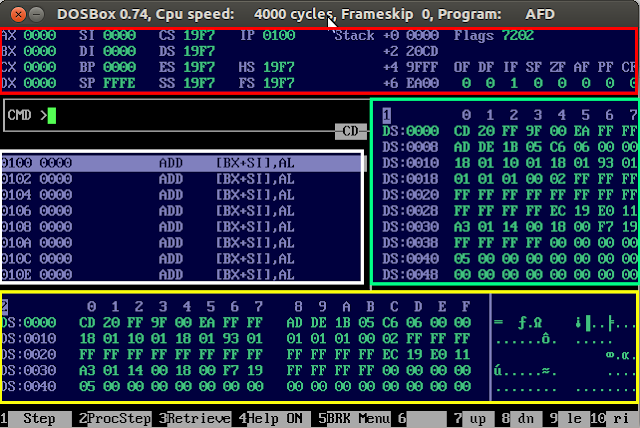
These 4 parts are described as follows
Red - Displaying All the Registers
Green - Displaying Memory Location 1
Yellow - Displaying Memory Location 2
Whereas White for disassembly.
It will change the value of AX in first window to "0014" ( hexadecimal representation). Similarly operations on each register will change its value respectively .
But, What if you want to change the value of the register, manually, on the fly ?
In CMD You can simply type
R <register>=value or <register>=value ( both will work )
e.g.
AX=15 ( will set AX to 0015 )
BX=002A ( will set BX to 002A )

 if you need to change flag registers you can do it in two ways
1st: writing directly to 16bit flag register by typing
FL=<value>
e.g. FL=0060 ( it will set the value of Zero Flag, also shown in the image below)
2nd: writing directly to a single bit
e.g. CF = 1 ( setting carry flag )

The different flag bits are shown in the image to the left.
Their use is as follows,
F2 is used for step by step execution of instructions
whereas pressing F1 also executes instructions step by step until we encounter a "call" instruction ( that is used to call a procedure ) it will "step into" rather then stepping over the line ( like in case of F1 key ). Non technically, it means that pressing F1 will make AFD to jump to the first instruction of the procedure and highlight that instruction ( to keep things simple I am skipping the use of stack in call instruction ).
For code Window we have discussed Step Over and Step Into ( a.k.a procedure Step ) keys. I will cover "alter/assemble code in AFD" in advance section ( next tutorial ) although it is very useful as well as powerful feature but , again , to keep things simple let's discuss it later .
the command to watch a memory is
<memory> <address>
e.g.
m1 <address> or m2 <address>
whereas address part has some variation depending upon how you use it. The variations are as follows
1 - m2 <constant address> e.g.
2 - m2 <register> e.g.
3 - m2 segment:<register> e.g.
and the most powerful
4 - m2 [<register>] e.g. m2 [DI], m2 [SI]
5 - m2 segment:[<register>] e.g. m2 DS:[SI], m2 DS:[BX], m2 CS:[BX] etc
note the brackets [ ] around register. Example is also given in the image below
with the last variation the memory window will keep track of the register mentioned in the brackets and change itself with respect to that register. This image shows 1 of the above mentioned ways to manipulate the memory window ( memory window 1 in this case )

Note: To save yourself from writing the commands again and again you can use 'F3' as AFD maintains history of all the commands user had used. Pressing F3 repeatedly will take you through all of them.
In this article, I have covered basic and commonly used set of instructions to debug 16bit 8086 assembly. In my next article, I will explore some advance features to further facilitate this debugging process. I will also update this article and add the link to that article as soon as i finish writing that up.
Update : Link to Part 2 - 8086 Assembly Debugging with AFD - Advance Full Screen Debug [PART 2 - Advance]
While, doing my research I found a list of debuggers that are available these days to debug 8086 programs. Some of them are listed below
- TR - ( no official link available + shareware)
- grdb - Kind of an enhanced version of debug.exe ( discontinued after Windows XP )
- Insight - The one with the most user friendly interface
There was another debugger that I couldn't find on the internet and that I used when I wrote my first 8086 assembly program in my university. It is Advance Full Screen Debug a.k.a AFD.
( In usability I will still rate AFD less than that of Insight )
The two images below are of AFD ( left ) and Insight ( Right ) . Insight has a Menu system like the one we see in most of the GUIs of modern applications. Other than that both debuggers have their own features, pros and cons so I am leaving it here for the readers to explore which one is better .


Well continuing my research story I was able to find neither any documentation nor any official site of AFD . So I thought of writing a small manual/document for those who never used any assembly level debugger before.In this article we will try to explore some useful features of AFD that will make assembly language debugging a bit more easier.
I am going to divide this tutorial in two parts. 1st will deal with basic features and 2nd will be on some advance uses of AFD.
So, If you haven't setup the environment for 8086 assembly language programming yet , you should read Setting up AFD, NASM and DOSBOX for 8086 assembly ( Step By Step ) first.
From here on, I will assume that you have configured the environment and you also know a little bit about 8086 assembly language programming.
The very first advice that i would like to give is to always use "F4" key. Pressing it will show the help text related to where your cursor is .

As an example, in the image to the left, I have pressed "L" while in AFD's cmd and then pressed 'F4' . You can see the help text related to cursor that is currently on character 'L' in cmd.
Note: To load a COM in AFD you can either run afd using this command "afd test.com" where test.com is a filename. Second way is shown in the image, after running AFD , write "L test.com".
I have divided AFD display into 4 parts as shown in the image below.

These 4 parts are described as follows
Red - Displaying All the Registers
Green - Displaying Memory Location 1
Yellow - Displaying Memory Location 2
Whereas White for disassembly.
REGISTERS' WINDOW
The 1st window ( Red One ) is for displaying the values in all the registers. The values in registers updates after each execution step. like if we have an instructionMOV AX,0014It will change the value of AX in first window to "0014" ( hexadecimal representation). Similarly operations on each register will change its value respectively .
But, What if you want to change the value of the register, manually, on the fly ?
In CMD You can simply type
R <register>=value or <register>=value ( both will work )
e.g.
AX=15 ( will set AX to 0015 )
BX=002A ( will set BX to 002A )
1st: writing directly to 16bit flag register by typing
FL=<value>
e.g. FL=0060 ( it will set the value of Zero Flag, also shown in the image below)
2nd: writing directly to a single bit
e.g. CF = 1 ( setting carry flag )

The different flag bits are shown in the image to the left.
INSTRUCTIONS' WINDOW
Let's move to the 2nd window that is the White one. This window shows the instructions in the program. The current instruction is always highlighted with white color. You can execute the instruction using two function keys F1 and F2. These are the most frequently used keys when working in AFD.Their use is as follows,
F2 is used for step by step execution of instructions
whereas pressing F1 also executes instructions step by step until we encounter a "call" instruction ( that is used to call a procedure ) it will "step into" rather then stepping over the line ( like in case of F1 key ). Non technically, it means that pressing F1 will make AFD to jump to the first instruction of the procedure and highlight that instruction ( to keep things simple I am skipping the use of stack in call instruction ).
For code Window we have discussed Step Over and Step Into ( a.k.a procedure Step ) keys. I will cover "alter/assemble code in AFD" in advance section ( next tutorial ) although it is very useful as well as powerful feature but , again , to keep things simple let's discuss it later .
MEMORY WINDOWS
The other two windows are used for displaying the content in memory. The window colored green is "m1" and the window colored yellow is "m2". Memory2 or m2 has an advantage that it shows large area of memory and on its right side you also have character representation of hex values. This is useful in debugging string data. In a nutshell when our program has some data in main memory we need m1 and m2 to watch that data.the command to watch a memory is
<memory> <address>
e.g.
m1 <address> or m2 <address>
whereas address part has some variation depending upon how you use it. The variations are as follows
1 - m2 <constant address> e.g.
CMD> m2 011Awill show memory starting from address 011A in "m2"
2 - m2 <register> e.g.
CMD> m2 AXsame as above now address is the value in AX
3 - m2 segment:<register> e.g.
CMD> m2 DS:SInow address is a calculated from segment and offset pair
and the most powerful
4 - m2 [<register>] e.g. m2 [DI], m2 [SI]
5 - m2 segment:[<register>] e.g. m2 DS:[SI], m2 DS:[BX], m2 CS:[BX] etc
note the brackets [ ] around register. Example is also given in the image below
with the last variation the memory window will keep track of the register mentioned in the brackets and change itself with respect to that register. This image shows 1 of the above mentioned ways to manipulate the memory window ( memory window 1 in this case )
Note: To save yourself from writing the commands again and again you can use 'F3' as AFD maintains history of all the commands user had used. Pressing F3 repeatedly will take you through all of them.
In this article, I have covered basic and commonly used set of instructions to debug 16bit 8086 assembly. In my next article, I will explore some advance features to further facilitate this debugging process. I will also update this article and add the link to that article as soon as i finish writing that up.
Update : Link to Part 2 - 8086 Assembly Debugging with AFD - Advance Full Screen Debug [PART 2 - Advance]
didn't help at all. i wanted to know the commands. like the keyboard commands
ReplyDeleteThank You and I have a swell supply: Who Repair House Windows split level house renovation
ReplyDeleteAmazing Articles
ReplyDelete